Kernel Tuning Methodology
C-Kernel-Engine performance work is not a benchmark stunt. The goal is to make a CPU node behave like a serious compute device: correct first, measurable at every layer, then pushed toward the roofline one kernel at a time.
North Star
CK should make each CPU node run as close as practical to its hardware limits, then compose those nodes into larger CPU-native systems. The engine is written from the ground up in C so the team can inspect, replace, profile, and verify each transformer stage instead of treating inference as a black box.
The methodology is simple: prove the model is still coherent and numerically connected, profile the exact hot path, isolate the slow kernel, improve one bottleneck, and rerun the same gates. No speed patch is accepted because it "looks fast" in isolation.
Hard Rule
Performance changes must keep the model path valid.
- First-token parity must not regress.
- Multi-token mismatch must not move earlier without explanation.
- Practical prompts must remain coherent, not just syntactically alive.
- OCR, vision, and long-context paths must be tested with real artifacts when available.
- Every meaningful PR should link benchmark logs and profiler artifacts.
Measurement Lanes
The work is split into lanes so we do not confuse different questions. A short chat prompt, a 4096-token prefill test, an Intel Advisor dot, and a VTune hotspot report are all useful, but they answer different things.
Practical E2E Lane
Run real prompts through cks-v8-run with the correct chat template, tokenizer, context length,
and decode budget. This lane answers: does the model still speak coherently, follow the prompt, and produce
useful output?
Fixed-Token Throughput Lane
Use controlled prompt and decode token counts, such as p512, p1024,
p2048, or p4096. This lane answers: how fast is prefill or decode when the model
actually receives that many tokens?
Operator Profile Lane
Enable CK profile CSV/JSON and rank time by operator. This lane answers: is the wall time in Q4/Q6 prefill, Q8 projection, attention, SwiGLU, quantization, sampling, or runtime overhead?
Microkernel Lab
Extract one kernel with the production dimensions and run it alone. This lane answers: can this exact kernel reach the expected instruction rate before we wire it back into the full transformer?
Advisor Roofline Lane
Use Intel Advisor to place loops by arithmetic intensity and throughput. This lane answers: should the next patch move the kernel right by increasing reuse, or up by improving SIMD and instruction efficiency?
VTune Lane
Use VTune hotspots, uarch exploration, memory access, and threading analysis. This lane answers: are we retiring useful work, stuck on ports, memory-bound, cache-latency-bound, or underusing physical cores?
Context Is Not Tokens
--context-len 4096 as a 4096-token prefill test.
Context length sets KV-cache capacity. It does not turn a 40-token prompt into a 4096-token workload. Long-prefill
performance must be measured with a tokenizer-counted prompt that actually contains the requested number of tokens.
This distinction matters because prefill is GEMM-heavy and decode is usually GEMV-heavy. A short prompt with a large
context window mostly tests runtime overhead plus decode. A true p4096 prompt tests the batched prefill
path, weight reuse, quantized GEMM dispatch, thread scheduling, and cache behavior.
Toolchain
| Tool | What It Tells Us | Typical CK Decision |
|---|---|---|
| CK profile CSV | Exact operator time inside the generated runtime. | Pick the real hot kernel instead of guessing from end-to-end time. |
| Intel Advisor | Roofline position, arithmetic intensity, GFLOPS/GINTOPS, vectorization hints. | Fuse, repack, tile, or improve SIMD depending on whether the loop must move right or up. |
| Intel VTune | Hotspots, pipeline slots, retiring, front-end bound, back-end bound, memory stalls, port pressure, physical-core utilization, logical-core utilization. | Change dot structure, reduce reductions, fix thread underuse, inspect cache latency, or remove scalar overhead. |
perf stat |
Cycles, instructions, IPC, cache misses, branch misses, context switches, wall time. | Low-overhead regression gate before expensive profiler runs. |
| Flamegraph | Call-stack shape and whether time is in kernels, tokenization, sampling, or framework overhead. | Decide whether to optimize math, dispatch, or runtime glue. |
objdump, LLVM-MCA, uops.info, Intel SDE |
Instruction mix, AVX2/VNNI use, estimated port pressure, latency chains, static throughput. | Replace expensive instruction sequences and prove the compiler emitted the intended ISA path. |
| Valgrind/Cachegrind | Correctness, cache access shape, allocations, and memory mistakes. | Use for debug and memory-shape validation, not final speed numbers. |
Cross-Hardware Evidence Matrix
A kernel is not "CPU optimized" because it performed well on one host. CKE uses several hardware lanes to separate portable mathematics from ISA-specific implementation quality, heterogeneous scheduling, memory topology, and server-scale behavior.
| Hardware Lane | Primary Question | Tools and Evidence | Status |
|---|---|---|---|
| Intel Core i7, multiple generations | Do FP32 and quantized generated runtimes remain useful on commodity x86 systems? | Practical E2E, fixed-token throughput, parity, compiler and ISA inspection. | Active |
| Core i7-14700T | How close can AVX2/FMA/AVX-VNNI FP32 and Q4/Q5/Q6/Q8 kernels get to the useful roofline on a hybrid 8P + 12E CPU? Native BF16 is not claimed. | VTune hotspots/uarch/memory/threading, Advisor roofline, perf, flamegraphs, assembly, frequency and utilization. | Dedicated profiling node |
| TI TDA4VM ARM | Are FP32 and quantized contracts and kernels portable to ARM NEON and realistic embedded constraints? | Build and kernel parity, NEON path inspection, constrained-memory and practical runtime checks. | Active portability lane |
| Intel Xeon, 2nd/3rd/5th Gen | How do FP32/quantized AVX-512/VNNI and host-gated native BF16/AMX availability affect parity and throughput across generations? | ISA-appropriate kernel tests, model parity, larger artifacts, profiler summaries, and cross-generation comparisons. | External validation lanes |
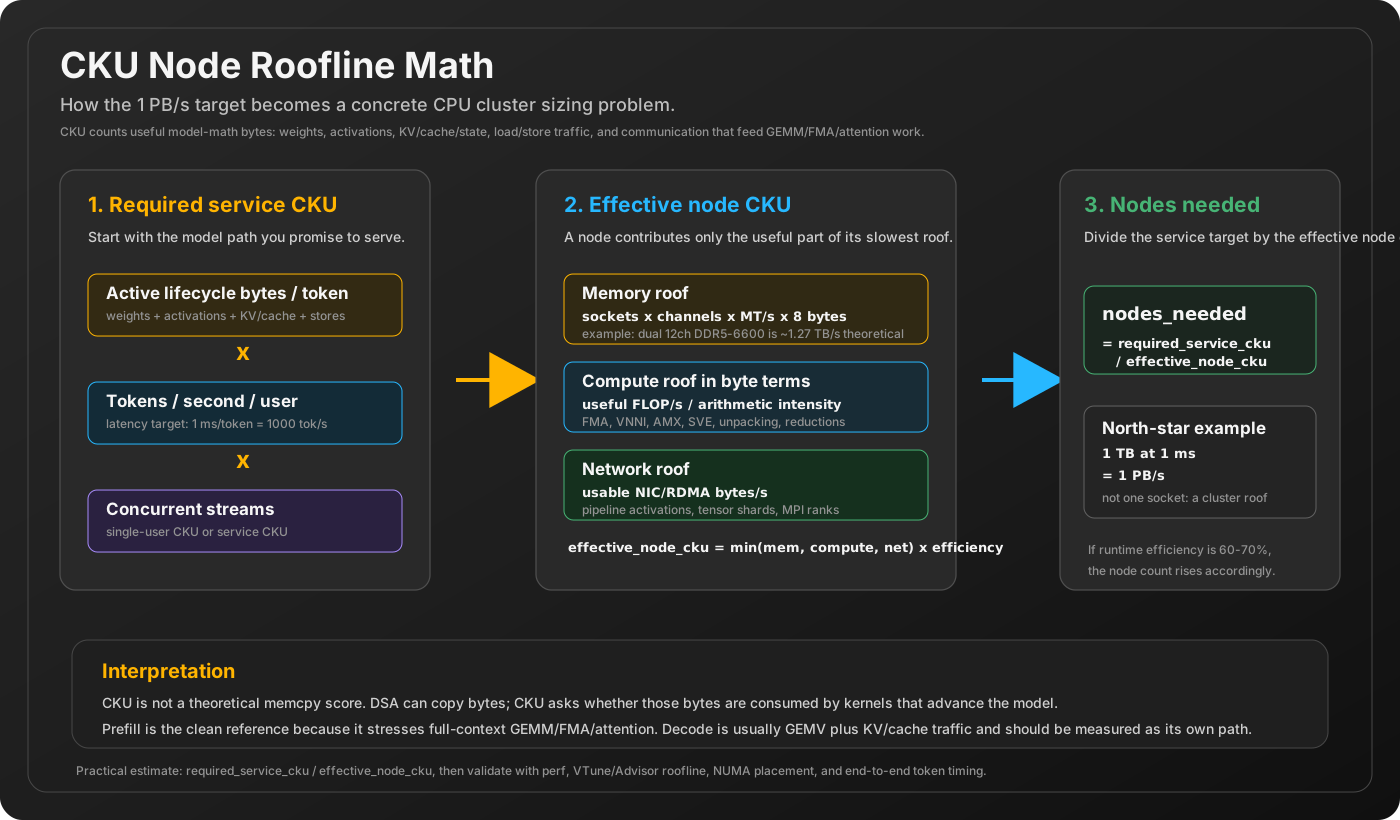
| Intel Xeon 6 | What do native AMX BF16, AVX-512/VNNI, wider memory systems, NUMA placement, sustained power, and multiple nodes enable? | Planned VTune/Advisor, native BF16, memory-channel roofline, NUMA, power, and distributed CKU experiments. | Planned; not measured |
Publication Contract
- Label the hardware lane as active, external, or planned; planned hardware has no benchmark result.
- Separate portable numerical evidence from ISA-specific throughput evidence.
- Compare before/after and reference runtimes on the same host with equivalent model and workload settings.
- Link raw commands, logs, profiler output, and the CKE commit behind every published performance table.
- Do not extrapolate one Core, Xeon, or ARM result to another generation without running that lane.
How To Read The Signals
| Profiler Signal | Meaning | Likely Fix |
|---|---|---|
| Low arithmetic intensity | The kernel does too little math per byte moved. | Pack weights, batch more rows, reuse activations, fuse producers/consumers, avoid scratch writes. |
| High retiring, low throughput | The CPU is doing useful work, but too many instructions are needed per result. | Reduce scalar bookkeeping, delay horizontal reductions, use wider dot instructions, precompute scale terms. |
| Port pressure | The loop is limited by execution resources, often ALU, shuffle, or load ports. | Change vector layout, reduce shuffles, unroll for independent accumulators, inspect assembly. |
| Memory bound | The loop is waiting on L1/L2/L3/DRAM rather than compute. | Retile, prefetch, reduce stores, improve packing, keep hot tiles in cache. |
| Low physical-core utilization | Threads are not doing useful work across the node. | Increase job count, use dynamic tiles, inspect affinity, reduce synchronization, avoid long tail work. |
| Coherence regression | The model circuit may no longer match the reference path. | Stop speed work and run parity: logits, layer dumps, RoPE/M-RoPE, KV-cache, quantized projection. |
Kernel Iteration Loop
- Reproduce: fix model, quant, prompt token count, context, threads, temperature, and runtime cache.
- Prove quality: run practical prompts and, when applicable, CK-vs-llama parity.
- Rank operators: collect CK profile CSV and identify the top one or two kernels.
- Profile deeply: run Advisor roofline and VTune on the exact workload or extracted kernel.
- Classify the bottleneck: compute-bound, memory-bound, instruction-heavy, scheduling-heavy, or parity-broken.
- Patch narrowly: change one kernel family, dispatcher rule, packing layout, or fusion path.
- Run microkernel checks: validate numerical output and isolated throughput before E2E.
- Run E2E again: measure practical prompts and fixed-token lanes across representative models.
- Attach logs: commit the commands, hardware, hashes, measured token counts, and profiler links.
Current v8 Lessons
The July 2026 AVX2 work produced several important lessons that should stay visible in the docs:
On the local AVX2 profiling host, practical short prompts showed coherent outputs and real decode speed, but they are not the same benchmark as fixed-token p4096 prefill. A stale p4096 table once suggested large CK wins over llama.cpp; a fresh recheck did not reproduce that claim. The defensible conclusion is narrower and more useful: the methodology caught the bad measurement trail, kept the coherent E2E signal, and forced the next pass back to token-counted prompts, canonical runtime paths, and profiler-backed kernel attribution.
Representative Commands
Use these as starting points. Record the exact model path, model hash, prompt token count, context length, thread count, compiler, and git commit in the log directory for the PR.
Practical Coherence Run
CK_NUM_THREADS=20 OMP_NUM_THREADS=1 \
version/v8/scripts/cks-v8-run run \
  hf://Qwen/Qwen3-0.6B-GGUF/Qwen3-0.6B-Q8_0.gguf \
  --context-len 1024 \
  --force-convert --force-compile \
  --generate-visualizer
Fixed-Token CK-vs-llama Matrix
CK_NUM_THREADS=20 OMP_NUM_THREADS=1 \
CK_V8_DECODER_MODELS=nanbeige4.1-3b-q4_k_m,qwen2-0.5b-q4_k_m,qwen3-0.6b-q8_0,qwen35-0.8b-q4_k_m \
CK_V8_DECODER_PROMPT=4096 \
CK_V8_DECODER_DECODE=128 \
CK_V8_DECODER_REPEATS=1 \
make test-v8-decoder-matrix
Operator-Cost Prefill Profile
CK_NUM_THREADS=20 OMP_NUM_THREADS=1 \
CK_V8_PROFILE_MODELS=nanbeige4.1-3b-q4_k_m,qwen2-0.5b-q4_k_m,qwen35-0.8b-q4_k_m \
CK_V8_PROFILE_PROMPT=4096 \
CK_V8_PROFILE_DECODE=1 \
CK_V8_PROFILE_CONTEXT=4608 \
make profile-v8-prefill-ops
Safe Perf Counter Lane
CK_NUM_THREADS=20 OMP_NUM_THREADS=1 \
CK_V8_PREFILL_PERF_ENGINE=both \
CK_V8_PREFILL_PERF_PROMPT=4096 \
CK_V8_PREFILL_PERF_DECODE=1 \
make profile-v8-prefill-perf-stat
What Gets Committed
A performance PR should not hide the measurement trail. Add a log directory under logs/ when the change
is meaningful, and reference it from the commit body.
| Artifact | Required Content |
|---|---|
| README | Hardware, compiler, git commit, model paths, hashes when available, prompt token counts, thread count, context length, commands, tables, and caveats. |
| Commit message | Problem, fix, measured result, parity/coherence gate, and link to the log directory. |
| Profiler links | Advisor HTML, VTune summaries, CK profile JSON/CSV, flamegraph, or perf-stat output when used. |
| Next steps | Known remaining bottlenecks, such as Q6 prefill, Gemma routing, Qwen3/Qwen3.5 long-context accounting, Qwen3-VL OCR parity, or decode GEMV improvements. |
Architecture Implication
CK can do this work because generated C keeps the system inspectable. Kernel maps and templates can replace a specific sequence with a fused kernel. The threadpool can be profiled directly. Quantized prefill dispatch can be changed without rewriting the whole runtime. The BUMP memory path and generated model code make it possible to tie one profiler dot back to one function, one tensor layout, and one source patch.
Open Work
- Token-counted practical long prompts: replace approximate text-length prompts with tokenizer-counted prompts at 1024, 2048, and 4096 tokens.
- Q4/Q6 prefill: continue moving packed Q4/Q6 GEMM loops toward roofline across Nanbeige, Qwen2, Qwen3/Qwen3.5, Gemma, and Qwen3-VL decoder shapes.
- Fusion: test gate/up GEMM + SwiGLU + Q8_K quantization fusion where it reduces scratch writes and preserves parity.
- Threading: keep dynamic scheduling and physical-core utilization measurable before adding complicated P-core/E-core policy.
- Deep VTune: use signed VTune drivers or a controlled profiling boot for deeper PMU collection when Secure Boot blocks out-of-tree modules.
- Parity harnesses: keep Qwen3-VL long-decode and OCR tests enabled while speed work continues.